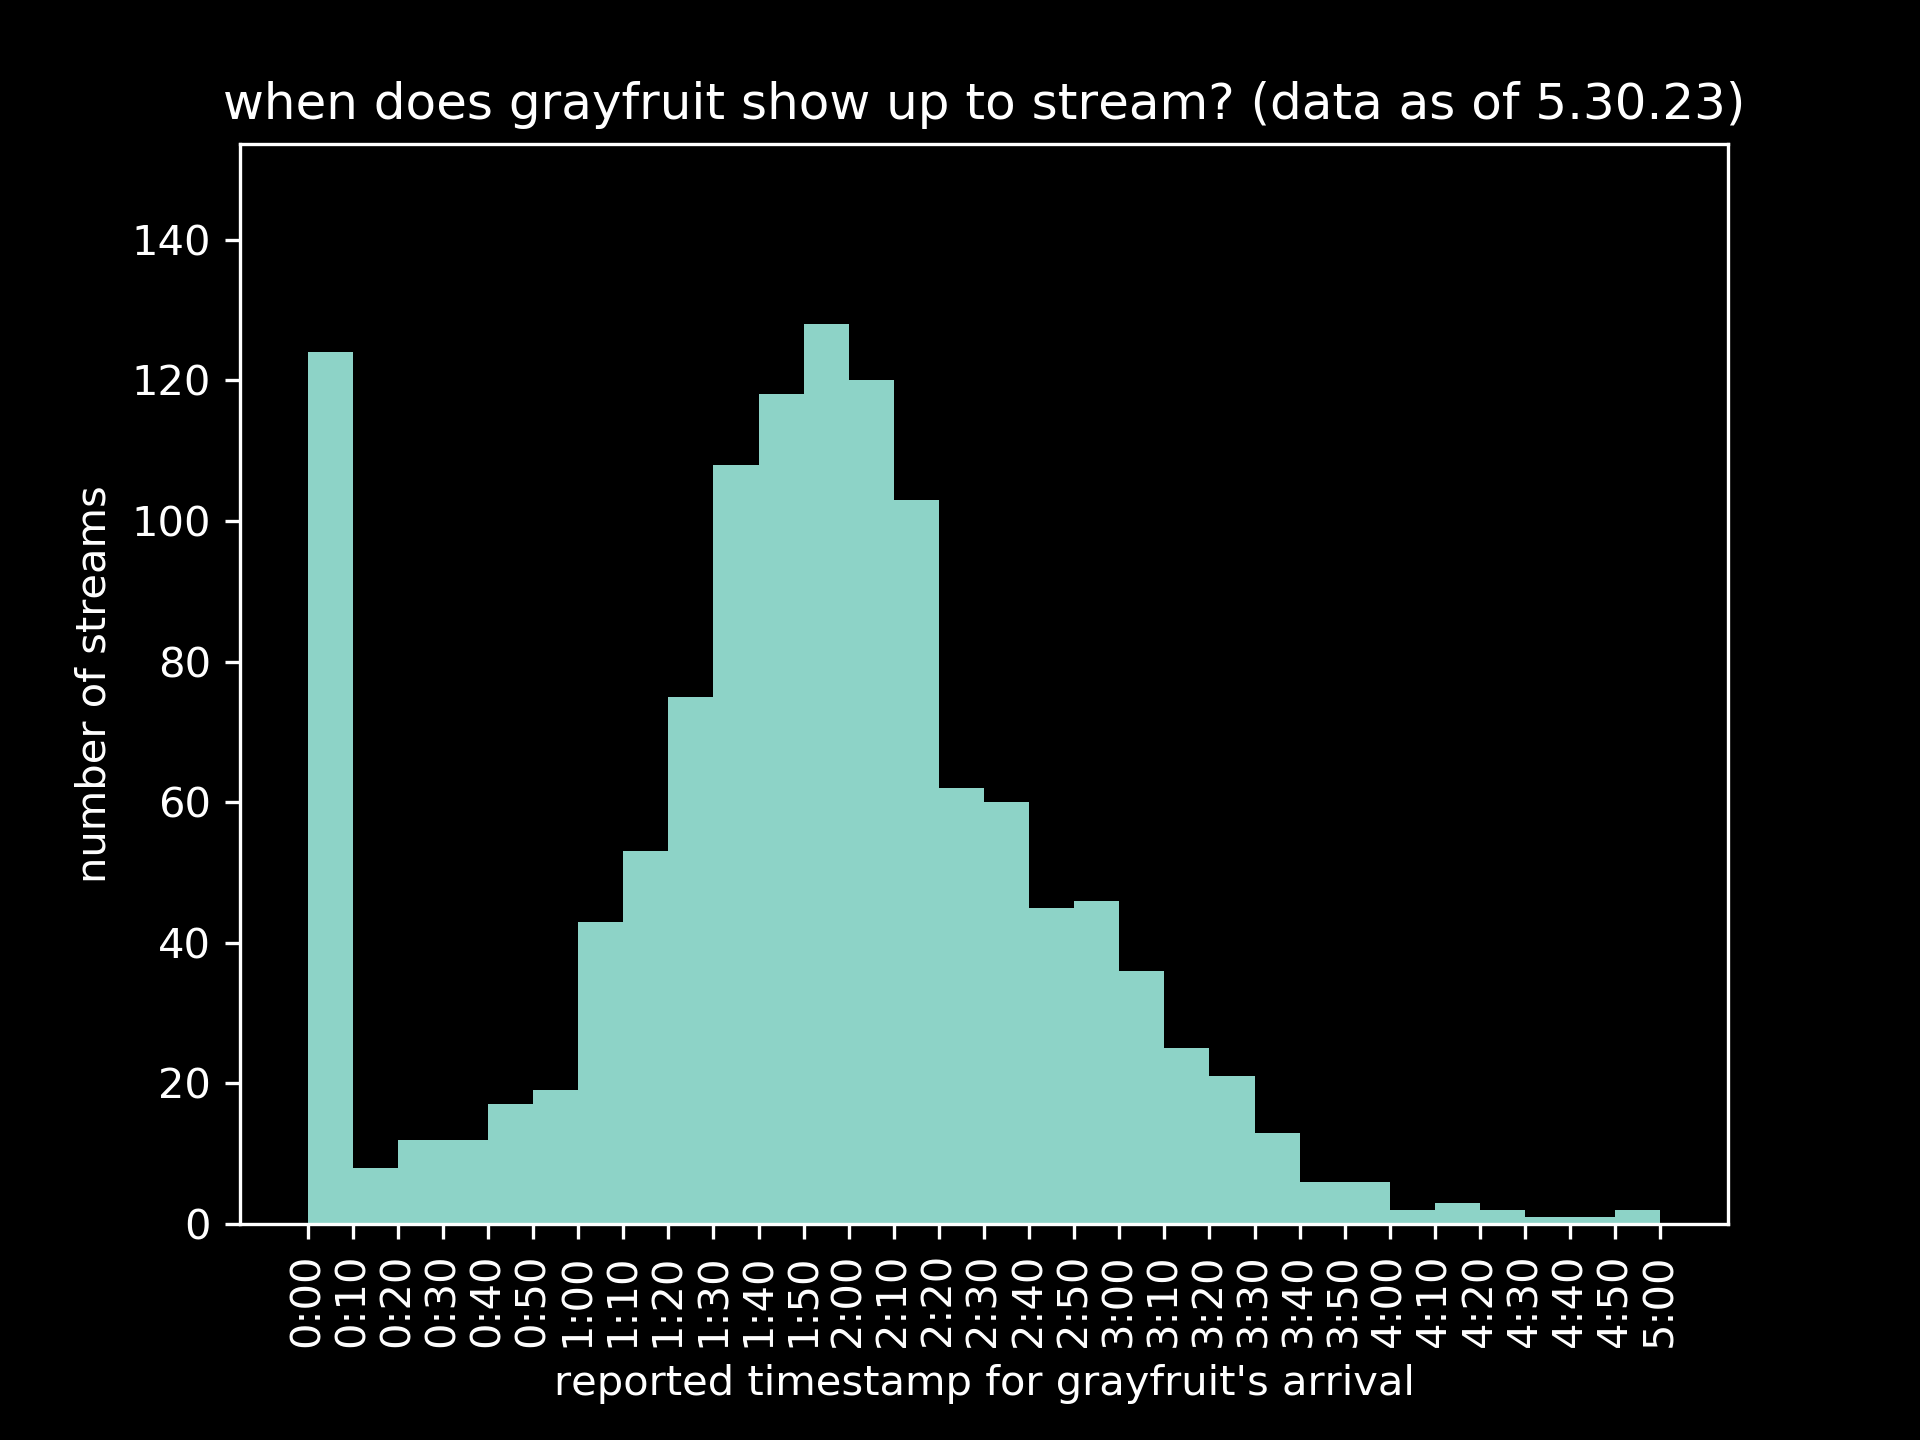
when does grayfruit show up to stream?
background
I like to watch a streamer called grayfruit, they are pretty chill and have good taste in games. All of his streams start with a piece of fanart and some music playing while he gets ready. I watch most of grayfruit’s streams on his vod channel, and it is customary for someone to post a funny comment that has timestamps to when grayfruit arrives/when the gameplay for the stream starts.

The above exchange is from this video, his first stream of Getting Over It with Bennet Foddy. Viewing the replies, I was curious – what time does grayfruit show up to stream, on average?
process
First I dumped the video IDs of every grayfruit video into one file that I could read from later, I just used yt-dlp for this as I had some prior experience with it.
Then I signed up for a Google API key, which would let me request the comment data for each video. I wrote a Python script that read the file full of video IDs, and wrote the data for the top 25 comments of each video into a JSON file.
Lastly, I processed the data with another Python script which would find the earliest timestamp in each videos’ comments and parsed it into a timedelta object, a type for storing an amount of time. Storing the time as a timedelta would make graphing and sorting the times easier down the line.

graphing and findings
I decided to only graph datapoints that were ≤ 5 minutes, as upon inspection most timestamps later than 5 minutes were mostly not referring to grayfruit’s arrival time. This preserves our sample size, bringing the total number of plotted videos from 1474 to 1271.
The graph looks good though, seems like the user from the original thread was pretty much right. Grayfruit’s average arrival time is 1:49.75, with a standard deviation of 0:54.95.
